The census, a national population survey conducted every decade, gives us the best glimpse of the identities and lives of the country’s population. The Tribune dug into the data from the 2021 census to find out: who are the people that make up Sheffield, and how is that population changing?
What’s happened to the overall numbers?
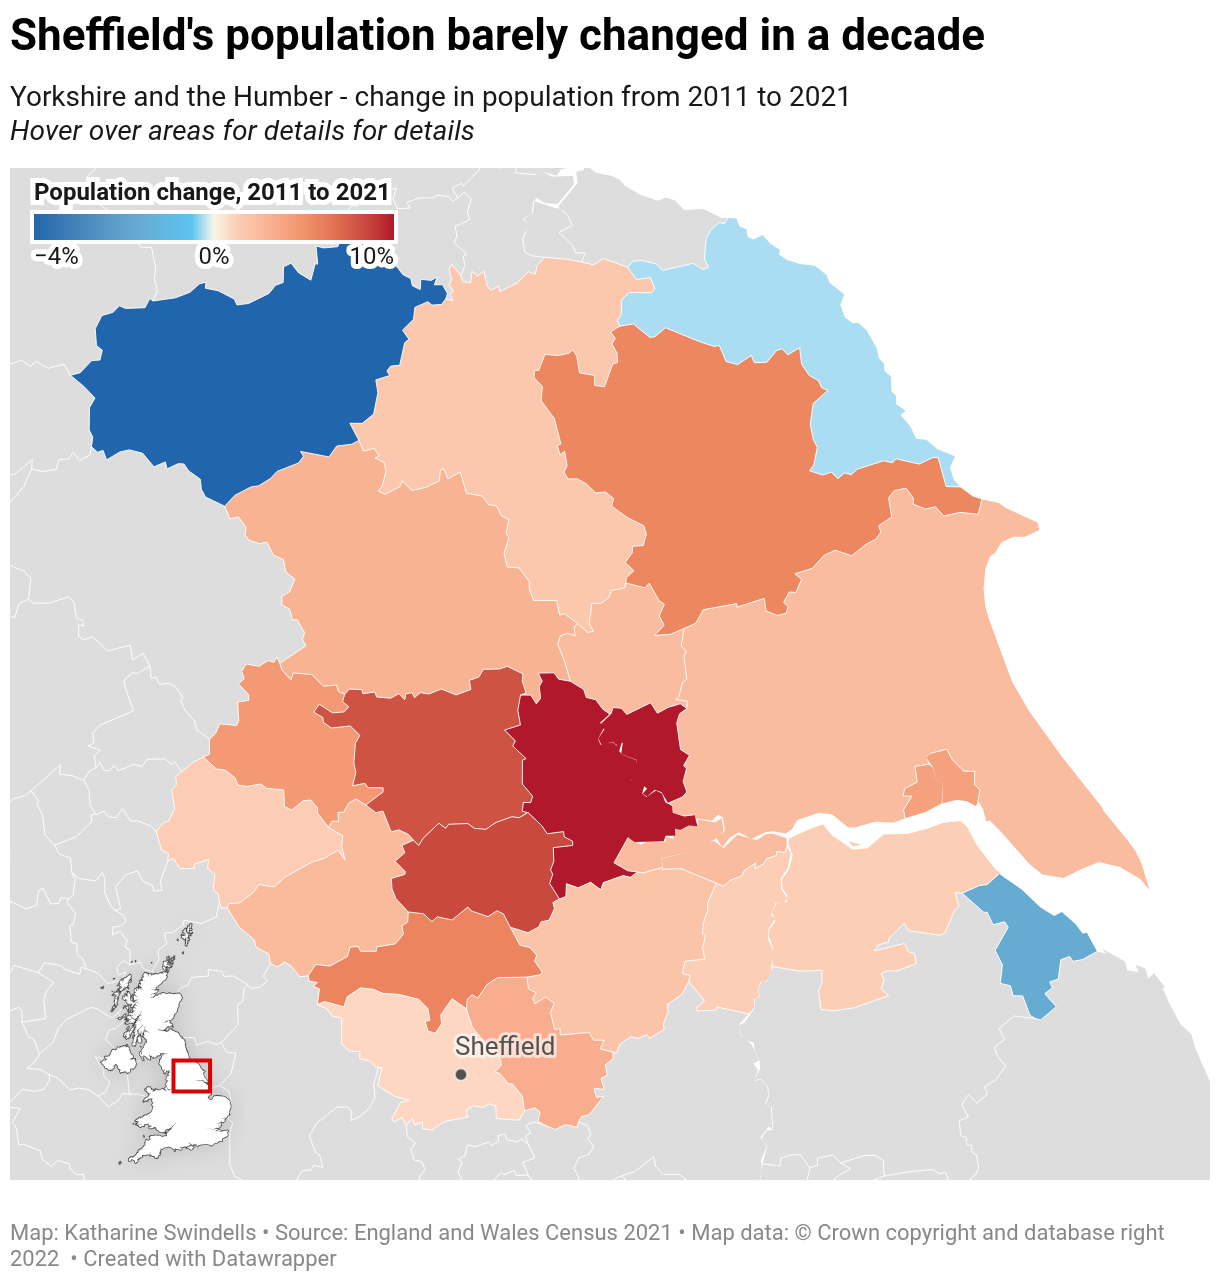
For starters, Sheffield’s population barely grew. The 2021 census found Sheffield had a population of 556,500, an increase of less than 4,000 from the previous census in 2011.
This equates to population growth of just 0.7%, far lower than the regional growth of 3.7%, or England’s national population increase of 6.6%. There’s a number of factors behind this: a low birth rate, compared to the region and country at large, as well as comparatively low levels of people moving in, in fact losing people to many surrounding areas, not gaining them.
It’s a worry for the city’s politicians, as a declining population of working age people could fuel further economic inactivity. Neighbouring local authorities all saw much higher population growth, particularly in Leeds, Wakefield and Selby.
What about age?
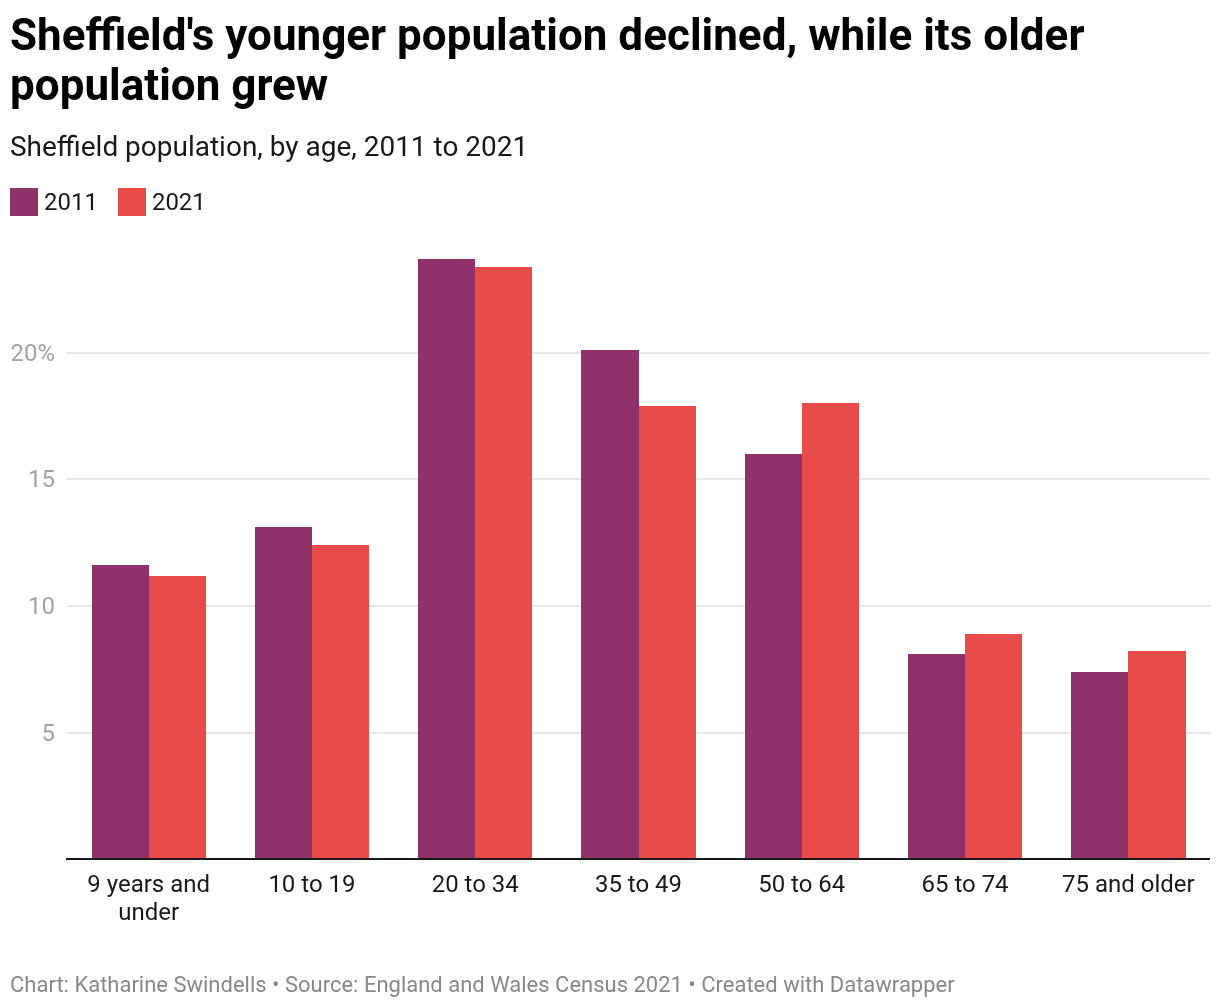
Like all of us, Sheffield is getting older. The median age of a Sheffield resident in 2021 was 37, up from 36 a decade before. This is still younger than the rest of Yorkshire though, where the median age was 40.
Back in 2011, 31.5% of Sheffield’s population was 50 or older; by 2021 that had risen to 35.1%.
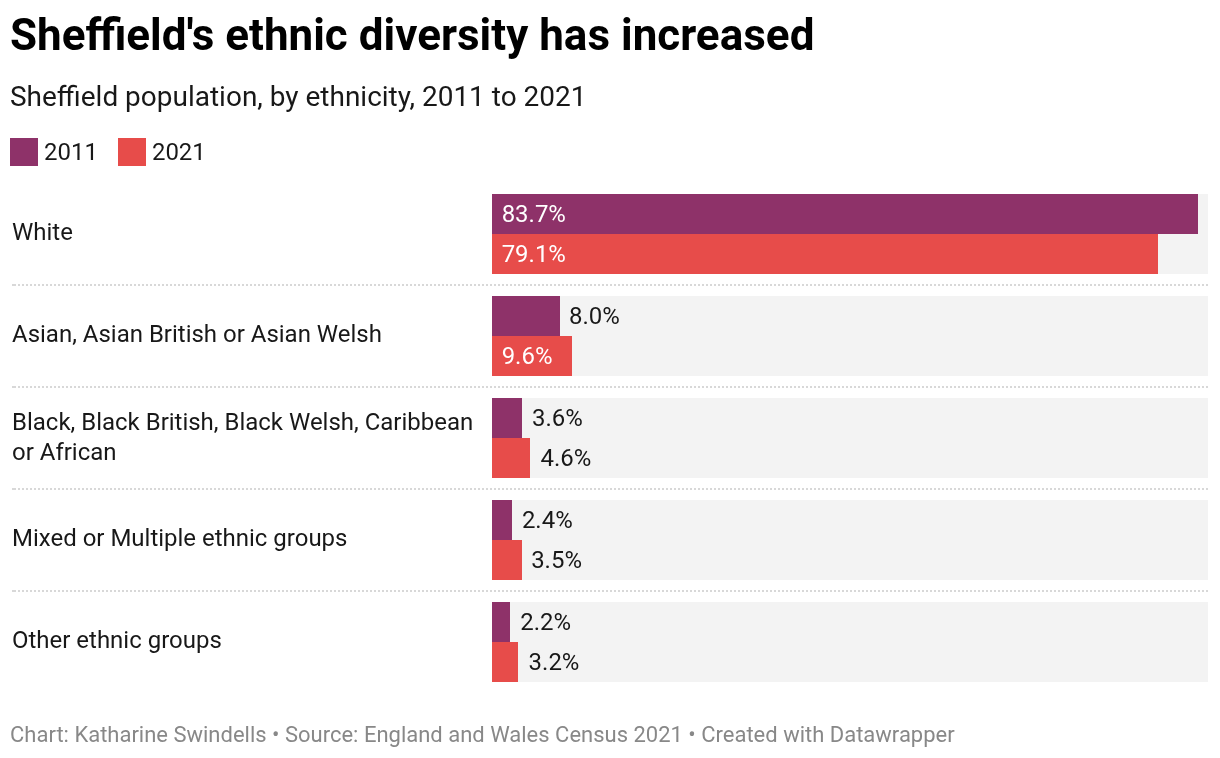
Is Sheffield becoming more ethnically diverse?
While the city's population is still very largely white — almost eight in 10 Sheffield residents noted this as their ethnicity on the census form – it’s a decrease on a decade before. That’s in line with the change seen across the region and nationally. At the same time, there’s been an increase in those identifying as Asian or Asian British, up to almost one in 10 Sheffield residents.
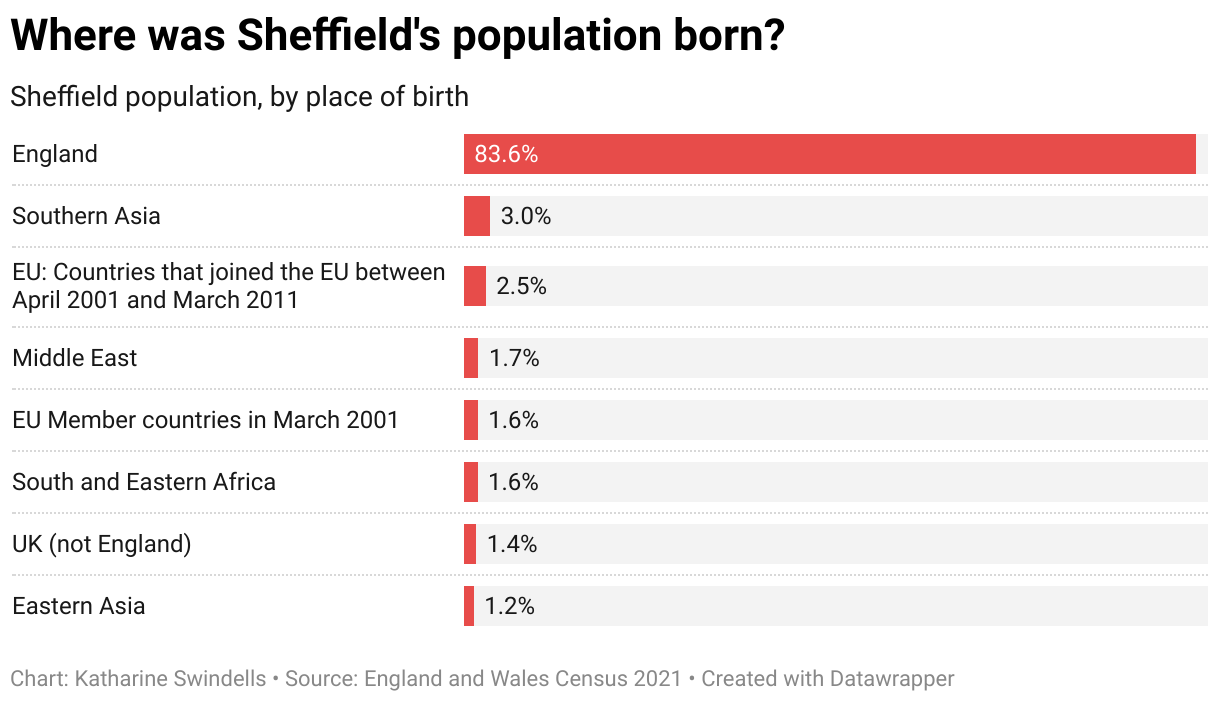
In 2021, 465,400 Sheffield residents said they were born in England, which amounts to 83.6% of the population. This is a decrease from 86.7% in 2011. After England, the most common country of birth among Sheffield residents was Pakistan, representing 1.8% of the city’s population. One in 50 Sheffield residents was born in a country that joined the EU between 2001 and 2011, such as Poland, Romania and Lithuania.
Much more dramatic, though, is the change in religion: 43.4% of Sheffield residents said they had ‘no religion’, much higher than 31.2% in 2011, making it the most common response to this question, while those identifying as Christian fell from 52.5% to 38.5%.
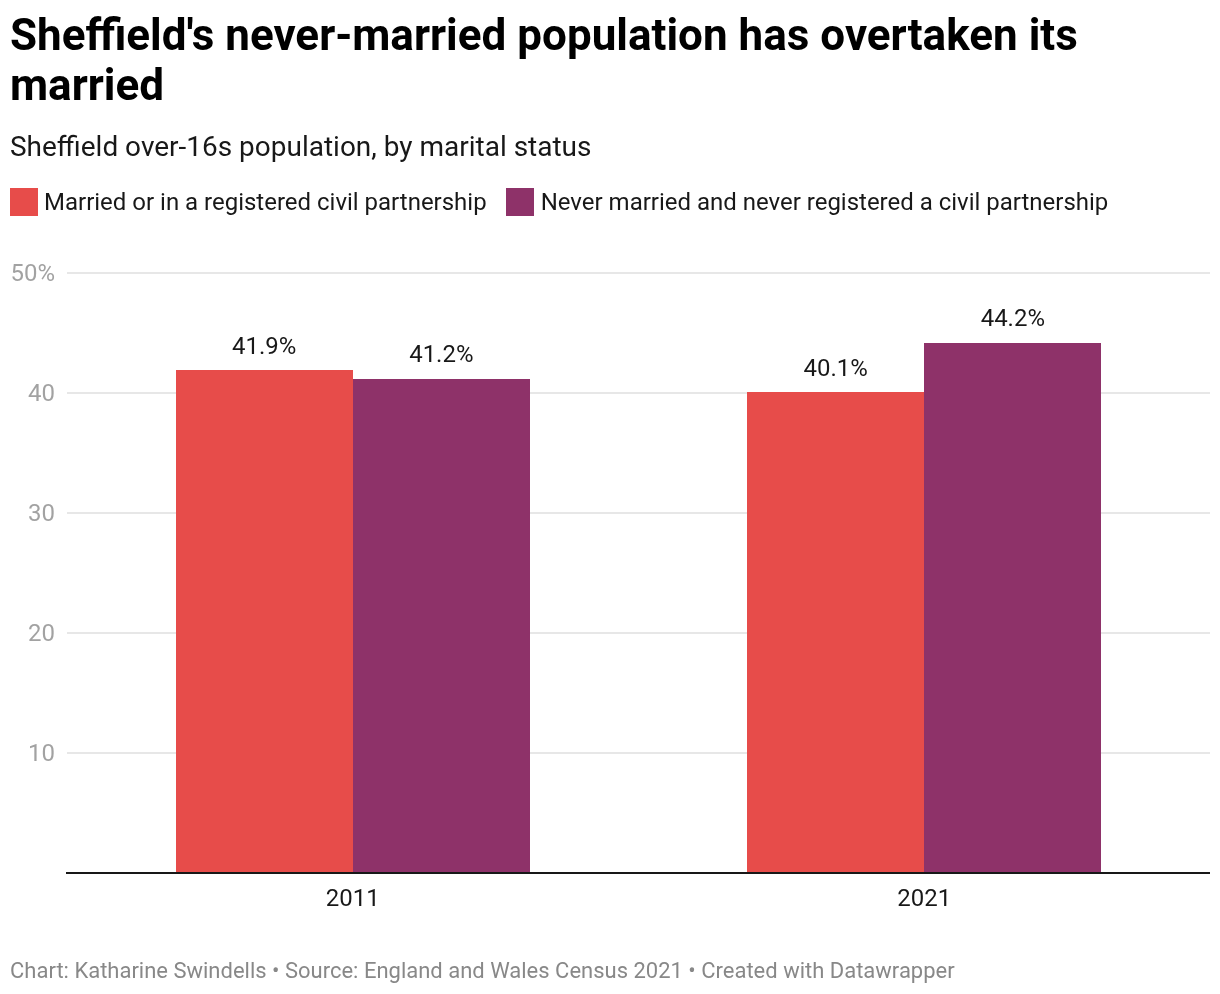
Are Sheffielders still getting married at the same rate?
The 2021 census showed that the proportion of people who have never been married or in a civil partnership (44.2%) has now overtaken the city’s married population.
40.1% of people said they were currently married, down from 41.9% a decade before. This shift is even more marked across the whole of Yorkshire and the Humber, where the married population fell from 47% to 44.2%.
Looking at families’ household make up in Sheffield, most have stayed consistent over the decade, though the proportion of single-parent households has increased from 10.4% to 11.1%, matching a trend seen nationwide.
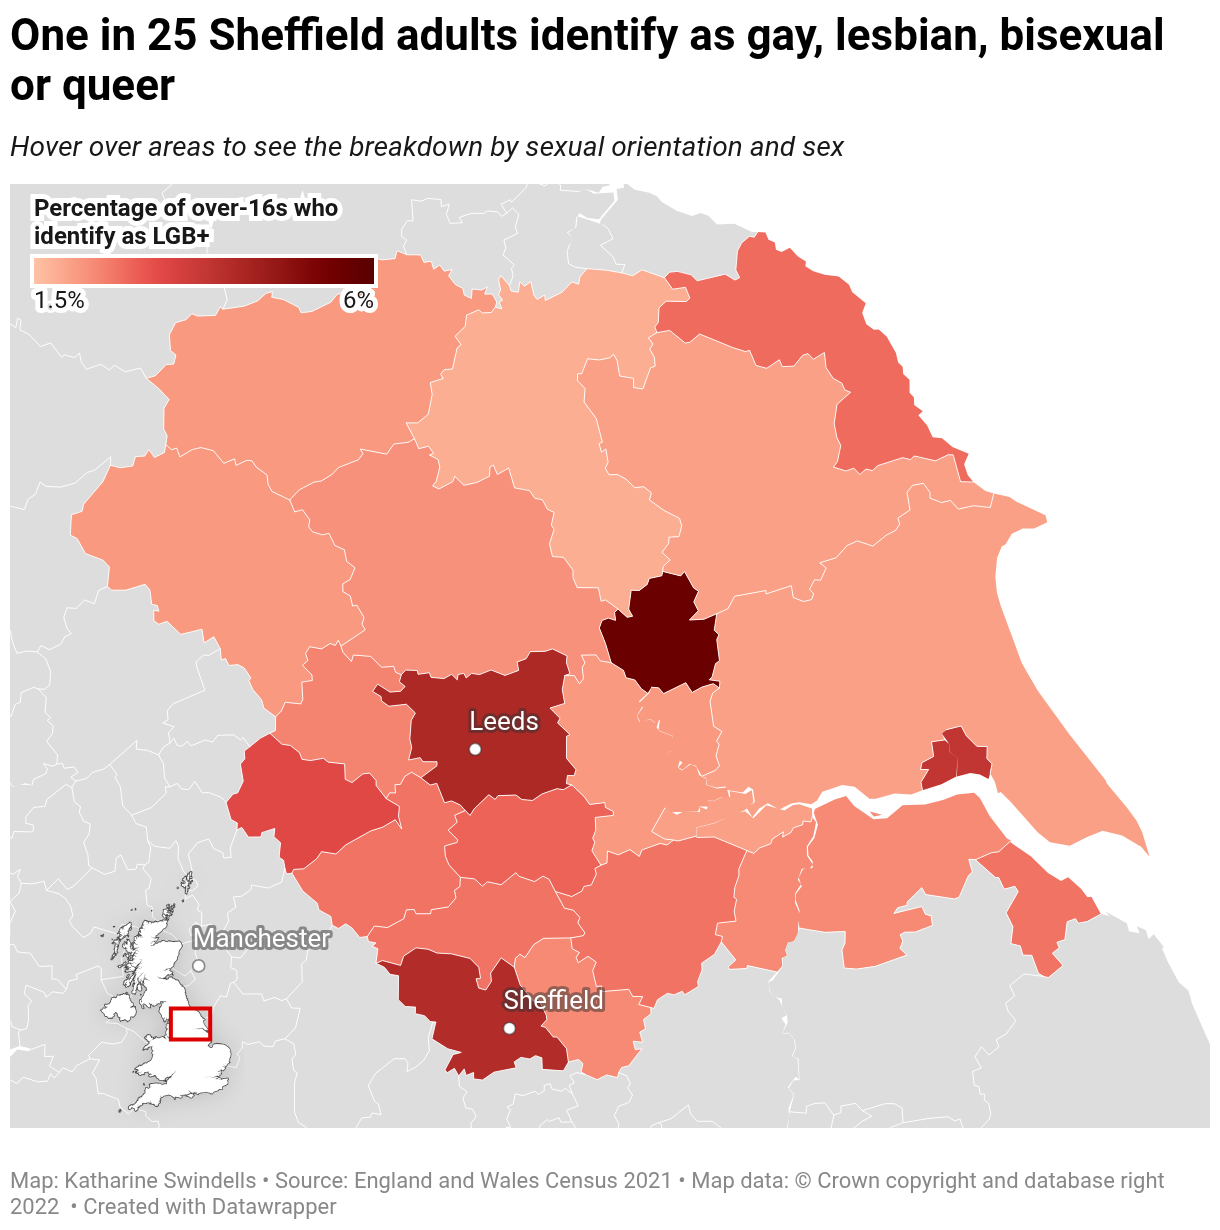
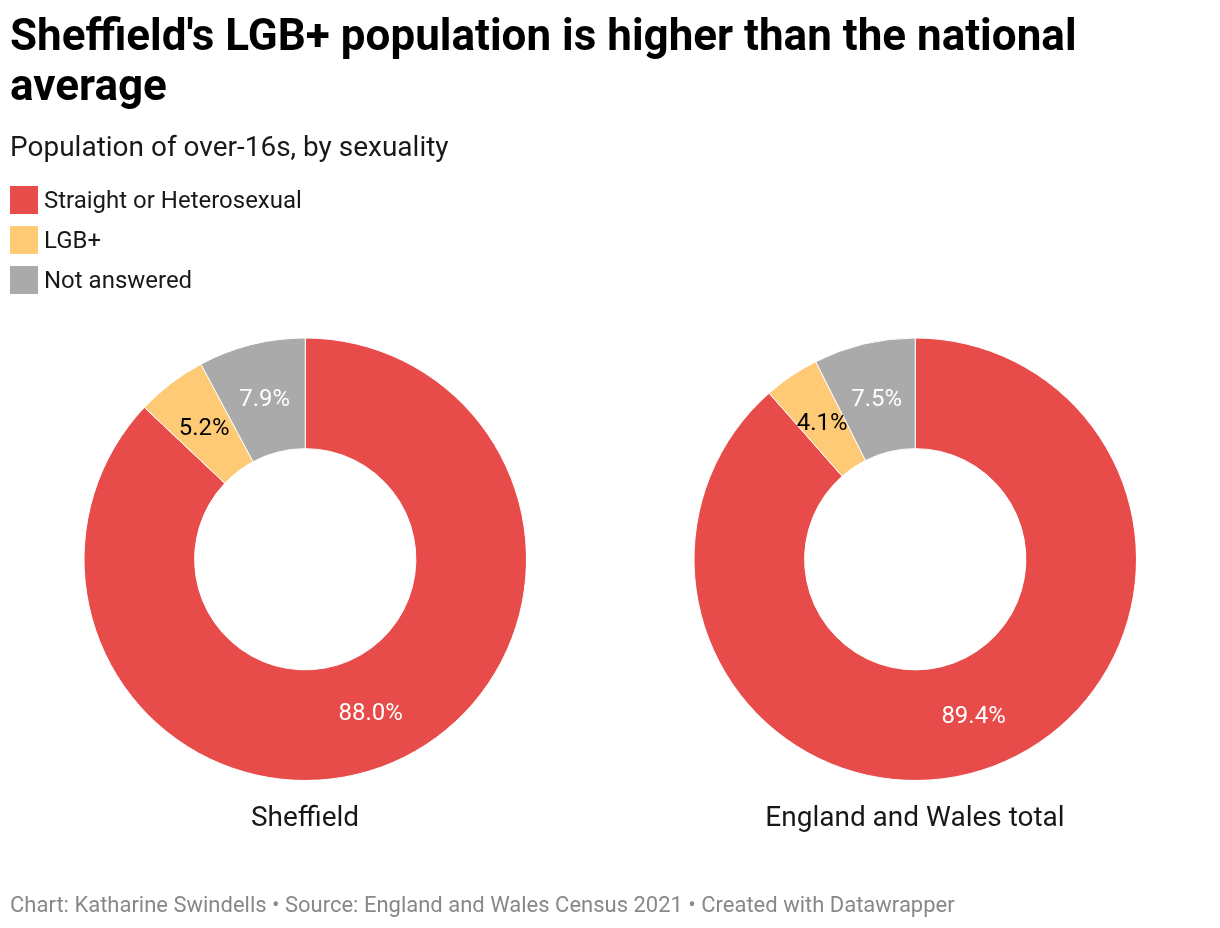
Sexuality in Sheffield
The 2021 census added a new category, for the first time asking respondents about their sexuality. So while this data can’t be compared over time, it does show that Sheffield has a higher LGB+ population than the nation at large, with one in 19 (5.2%) of the city’s over-16s identifying as lesbian, gay, bisexual or queer (England and Wales: one in 24).
In Sheffield, 13.1% of the LGB+ population are married or in a civil partnership, compared to 42.1% of the heterosexual population.
88% of Sheffield’s population identified as straight, lower than much of the surrounding areas and similar to Leeds, though higher than in Manchester. Hover over local authorities on the map for more information on the LGB+ population, and breakdown by gender.